Produced by our expert property research team, our new Monthly Research Snapshot is designed to monitor the progress of the commercial, residential and rural markets through a selection of key indicators.
KEY
|
Market accelerating |
↑ |
|
Market peak |
|
|
Market flat |
⟷ |
|
Market decelerating |
↓ |
|
Market bottoming |
|
ECONOMY
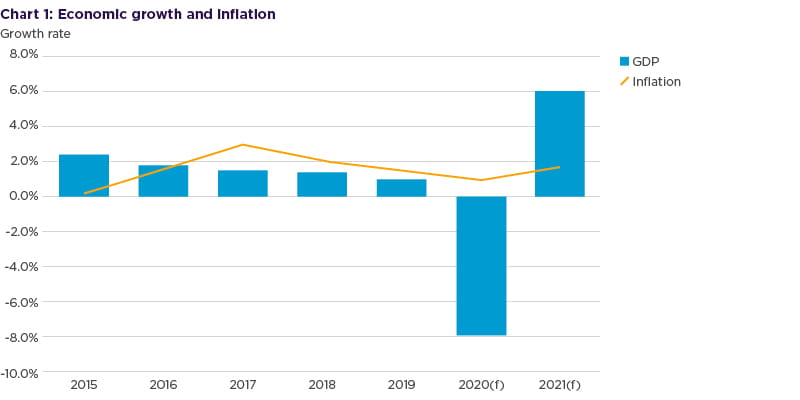
- GDP contracted by 10.4% in the three months to April, following a 3-month decline of 5.8% in March, indicating a sharp decline following the lockdown measures imposed by the UK government on 23 March.
- The lockdown also resulted in sharp falls of all three PMI measures to record lows, as the social distancing measures effectively halted activity. While the measures all recovered somewhat in May, they are still in contraction (below 50).
- The fall in inflation from 1.5% in March to 0.8% in April was the largest decline since December 2008. The figure for May fell further to 0.5% and is the lowest figure since August 2016.
|
|
February 2020 |
March 2020 |
April 2020 |
May 2020 |
5-year average |
Previous peak |
Trend |
|
GDP (quarterly) |
0.0% |
-2.0% |
-10.4% |
- |
0.0% |
0.7% (Q1 2019) |
↓ |
|
Construction PMI* |
52.6 |
39.3 |
8.2 |
28.9 |
50.3 |
52.6 (Feb 2020) |
|
|
Manufacturing PMI* |
51.7 |
47.8 |
32.6 |
40.7 |
52.2 |
51.7 (Feb 2020) |
|
|
Services PMI* |
53.2 |
34.5 |
13.4 |
29.0 |
51.5 |
53.9 (Jan 2020) |
|
|
CPI inflation (annual) |
1.7% |
1.5% |
0.8% |
0.5% |
1.6% |
2.1% (Jul 2019) |
↓ |
|
Unemployment rate (quarterly) |
4.0% |
3.9% |
3.9% |
- |
4.4% |
4.0% (Feb 2020) |
↑ |
|
FTSE All Share** |
3,673.6 |
3,107.4 |
3,262.5 |
3,402.1 |
3,830.5 |
4,196.5 (Dec 2019) |
n/a |
|
GBP 1: USD** |
1.2776 |
1.2403 |
1.2613 |
1.2368 |
1.3361 |
1.3179 (Jan 2020) |
n/a |
Source: ONS, Markit, Bank of England
* PMI’s are a leading indicator of economic activity; >50 represents expansion, <50 represents contraction
** Month-end figure
KEY FORECASTS
- As was expected, forecasts for GDP growth in 2020 fell below 0% in both April, May and June as a consequence of all markets closing due to the government-imposed lockdown effectively halted all market activity. Some economists have suggested the downturn in 2020 is likely to result in sharp growth in 2021, which has been reflected in the forecasts revised from 1.4% in February’s report to 6.2% in June.
- Where GDP, inflation and house prices are expected to recover in 2021, the forecasts for unemployment are expected to remain higher than in the pre-COVID figures. While the government’s furlough scheme has helped to protect many jobs, the economic downturn as a result of COVID-19 is likely to result in the collapse of more businesses over the coming months, contributing to the higher forecasts.
|
Forecasts for 2020 |
Date of forecast |
||||
|
Feb 2020 |
Mar 2020 |
Apr 2020 |
May 2020 |
Jun 2020 |
|
|
Annual GDP growth |
1.2% |
0.6% |
-5.8% |
-8.6% |
-9.2% |
|
Annual CPI Inflation |
1.8% |
1.5% |
1.1% |
0.9% |
0.7% |
|
Annual unemployment rate |
4.0% |
4.1% |
6.9% |
7.7% |
7.9% |
|
House price forecast |
2.2% |
1.7% |
-1.5% |
-3.8% |
-2.8% |
|
Forecasts for 2021 |
Date of forecast |
||||
|
Feb 2020 |
Mar 2020 |
Apr 2020 |
May 2020 |
Jun 2020 |
|
|
Annual GDP growth |
1.4% |
1.3% |
5.0% |
6.2% |
6.5% |
|
Annual CPI Inflation |
1.9% |
1.9% |
1.8% |
1.6% |
1.6% |
|
Annual unemployment rate |
4.0% |
4.1% |
5.5% |
6.3% |
6.6% |
|
House price forecast |
2.2% |
2.9% |
3.4% |
2.8% |
3.2% |
Source: HM Treasury comparison of independent forecasts
RESIDENTIAL
- As was expected, property transactions and mortgage approvals declined in March and fell dramatically throughout April.
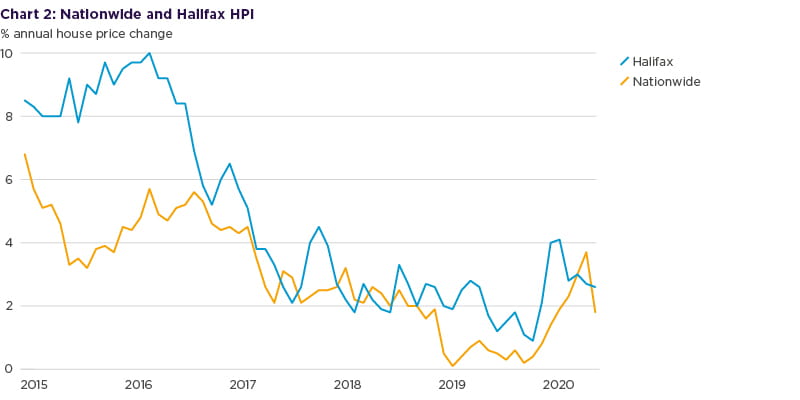
- Both the Nationwide and Halifax indices continued to point to growth in house prices, despite the market effectively closing for business due to government-imposed restrictions on buying and selling houses. However, given that so few transactions took place across both months, these figures must be treated with a degree of caution.
- Rental growth across the UK has remained broadly steady however regional variations were apparent. The South West experienced growth of 2.6% in April followed by 2.3% across the East Midlands, while the North East and North West saw lower, but positive, growth of 0.7% and 0.9% respectively.
|
|
February 2020 |
March 2020 |
April 2020 |
May 2020 |
5-year average |
Previous peak |
Trend |
|
Nationwide house price index (annual) |
2.3% |
3.0% |
3.7% |
1.8% |
2.7% |
3.2% (Jan 2018) |
↓ |
|
Halifax house price index (annual) |
2.8% |
3.0% |
2.7% |
2.6% |
4.5% |
4.1% (Jan 2020) |
|
|
HMRC property transactions (3-month rolling) |
270,040 |
263,900 |
219,960 |
- |
300,632 |
315,720 (Jul 2019) |
↓ |
|
BoE mortgage approvals (3-month rolling) |
213,247 |
201,265 |
145,683 |
- |
199,664 |
205,804 (Feb 2017) |
↓ |
|
ONS rental growth (annual) |
1.4% |
1.4% |
1.5% |
- |
1.6% |
2.6% (Apr 2016) |
⟷ |
|
Glenigan construction starts index* |
138 |
133 |
99 |
68 |
154 |
187 (May 2019) |
↓ |
Source: Nationwide, Halifax, HMRC, Bank of England, ONS, Glenigan, ONS
* Residential projects valued up to £100 million
RURAL
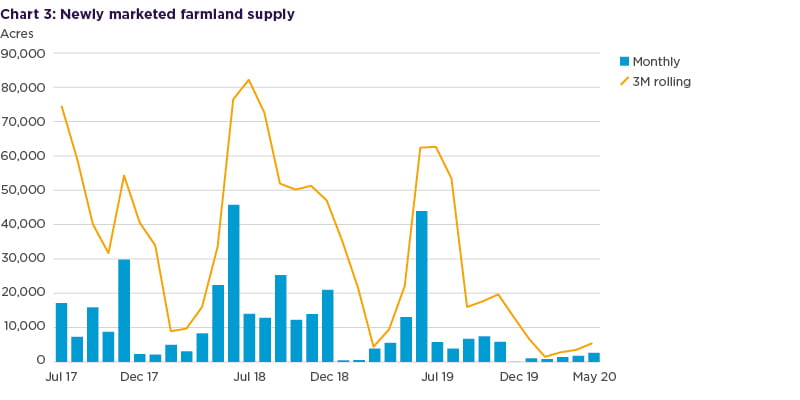
- As at May, year-to-date publicly marketed farmland was at an all time low, largely due to the delay of launches which were originally earmarked for March and April. Supply levels have been constrained for some time, and the lockdown measures pushed figures for 2020 down significantly. However, now that measures have somewhat eased, the market has opened up and we expect an increase in acres available on the market over the coming months.
- The oil market has also been impacted and has driven major oil companies to slim back production as a result of storage capacity reaching its maximum level.
|
|
February 2020 |
March 2020 |
April 2020 |
May 2020 |
5-year average |
Previous peak |
Trend |
|
New farmland supply (3-month rolling) |
1,642 acres |
2,970 acres |
3,674 acres |
5,534 acres |
35,826 acres |
62,549 (Jul 2019) |
↑ |
|
Brent crude oil (US$/barrel) |
55.5 |
33.9 |
17.7 |
25.2 |
54.0 |
79.4 (Oct 2018) |
|
|
Beef prices (pence/kg DW) |
335.7 |
335.9 |
327.8 |
355.9 |
345.9 |
369.9 (Jun 2018) |
⟷ |
|
Milk prices (pence/litre) |
28.7 |
28.6 |
27.6 |
- |
27.0 |
31.6 (Nov 2018) |
⟷ |
Source: Farmers Weekly, AHDB
COMMERCIAL (OCCUPIER)
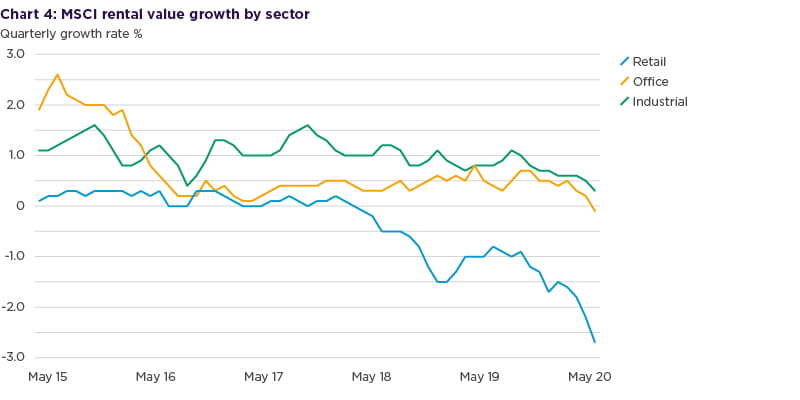
- Quarterly rental growth reduced across all sectors in April and further in May, with the retail market showing the biggest fall. Many tenants, across all three commercial sectors, have sought relief from landlords in deferring their rent bills, and many are seeking government support in order to weather the current storm.
- The fall in the retail sales index was the largest in recorded history, as a consequence of all retailers closing down because of the lockdown. However, retail sales were already showing signs of reducing as internet sales strengthened.
- Consumer confidence has taken a large hit, with the overall index falling to -34 in April from -9 in March. The expectations for the general economic situation over the next 12 months fell by 29 points to -52 in April, while the personal finance measure over the next 12 months reduced by 11 points to -14.
|
|
February 2020 |
March 2020 |
April 2020 |
May 2020 |
5-year average |
Previous peak |
Trend |
|
MSCI office rental growth (quarterly) |
0.5% |
0.3% |
0.2% |
-0.1% |
0.7% |
0.8% (Apr 2019) |
|
|
MSCI industrial rental growth (quarterly) |
0.6% |
0.6% |
0.5% |
0.3% |
1.0% |
1.1% (Aug 2019) |
|
|
MSCI retail rental growth (quarterly) |
-1.6% |
-1.8% |
-2-2% |
-2.7% |
-0.4% |
0.3% (Dec 2016) |
↓ |
|
Number of office lettings over 20,000 sq ft in key locations* (3-month rolling) |
40 |
32 |
27 |
23 |
56 deals |
75 (Oct 2018) |
|
|
Number of distribution lettings over 50,000 sq ft in the UK (3-month rolling) |
37 |
29 |
30 |
29 |
86 deals |
111 (Dec 2018) |
|
Source: MSCI, CoStar, Carter Jonas
* Central London, Oxford, Cambridge, Birmingham, Bristol, Bath, Leeds, Manchester, Glasgow, Edinburgh
Key economic drivers
|
|
February 2020 |
March 2020 |
April 2020 |
May 2020 |
5-year average |
Previous peak |
Trend |
|
Retail sales volumes index* |
107.9 |
102.3 |
83.8 |
- |
102.7 |
109.1 (Jul 2019) |
↓ |
|
Internet sales as a % of all retailing* |
19.9% |
22.4% |
30.7% |
- |
16.8% |
n/a |
↑ |
|
GfK consumer confidence index |
-7 |
-9 |
-34 |
-36 |
-8 |
7 (Aug 2015) |
|
|
Employment rate (quarterly) |
76.6% |
76.6% |
76.4% |
- |
75.1% |
76.6% (Mar 2020) |
↓ |
Source: ONS, GfK
* All retailing exc. automotive fuel
COMMERCIAL (INVESTMENT)
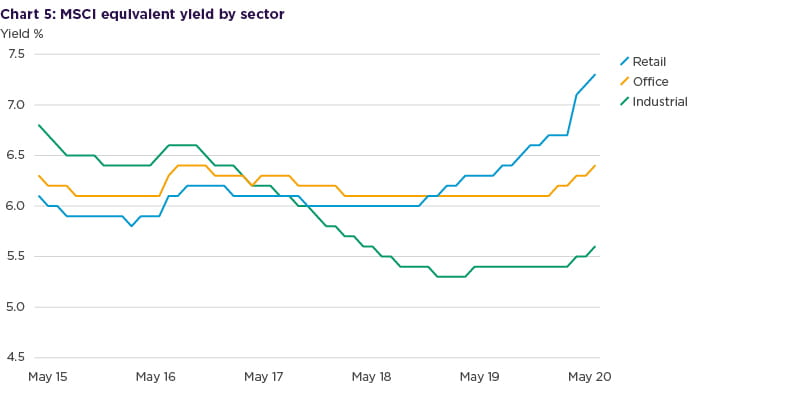
- While equivalent yields were already loosening, April saw a sharp rise, particularly in the retail sector.
- All property capital values fell by 5.3% in the 3 months to May, the lowest quarterly decline since June 2009. The all property figure has, however, disguised the sectoral differences. Across the same period, retail values fell by 9.6%, compared with a 3.5% reduction across the office sector and a 2.7% fall in industrial capital values.
- Total commercial property investment values fell significantly in the three months to March and April, although transaction levels remain robust at £12.9 billion in the three months to April, compared with a five-year average of £14.3 billion.
- The UK’s 10-year bond yield has fallen for five consecutive months and is now at a historic low at 0.18% as at the end of May.
|
|
February 2020 |
March 2020 |
April 2020 |
May 2020 |
5-year average |
Previous peak |
Trend |
|
MSCI all property capital growth (quarterly) |
-0.7% |
-2.7% |
-4.3% |
-5.3% |
0.1% |
2.0% (Dec 2017) |
|
|
MSCI office equivalent yield |
6.17% |
6.25% |
6.33% |
6.38% |
6.18% |
6.07% (Apr 2019) |
n/a |
|
MSCI industrial equivalent yield |
5.41% |
5.48% |
5.55% |
5.58% |
5.93% |
5.32% (Dec 2018) |
n/a |
|
MSCI retail equivalent yield |
6.71% |
7.07% |
7.24% |
7.33% |
6.18% |
5.97% (Jan 2018) |
n/a |
|
UK 10-year bond yield* |
0.45% |
0.36% |
0.23% |
0.18% |
1.18% |
1.58% (Sep 2018) |
n/a |
|
UK investment volumes (3-month rolling) |
£20.2bn |
£14.2bn |
£12.9bn |
£5.1bn |
£14.0bn |
£18.8bn (Jan 2018) |
↓ |
Source: MSCI, FT, Property Data
* Month-end figure
FOOTNOTES:
1. All data is externally sourced
2. Historic index figures may be revised
3. Data correct as at 17 June 2020
For further market information, or to speak directly to one of our property professionals, please contact us.
Michael is Head of Carter Jonas’ London Tenant Advisory Team and specialises in providing office search, lease negotiation, relocation management, rent review and lease restructuring consultancy services to office tenants based in Central and Greater London. He has over 20 years experience and his clients include international corporates such as Hitachi, Warner Bros and Hackett, not for profit organisations such as The Overseas Development Institute and The Nursing and Midwifery Council as well as owner-managed businesses including Wavex Technology, Credo Business Consulting and Turley Associates.
The range of consultancy services provided by Michael and his Team include advising on office availability, rents and rent free periods, undertaking property searches, representing tenants in lease negotiations, developing office relocation project plans, timetables and budgets and project managing each stage of the relocation process, including overseeing the pre-contract due diligence, and co-ordinating the activities of all those consultants who will be involved in the office move.
Scott specialises in providing advice on agency and development matters to a wide variety of clients from private individuals and trusts through to property funds, institutions, companies and statutory authorities. He advises both owners and occupiers across public and private sectors.
Working at Board level with clients, Scott’s specialist areas include Business development, development of property strategies, property investment advice, advice in the marketing and disposal of property as well as property acquisitions.
Scott has a particular knowledge and understanding of the property market in the wider Oxfordshire region whilst also operating on a national basis on specific projects.
